Productivity Dashboard
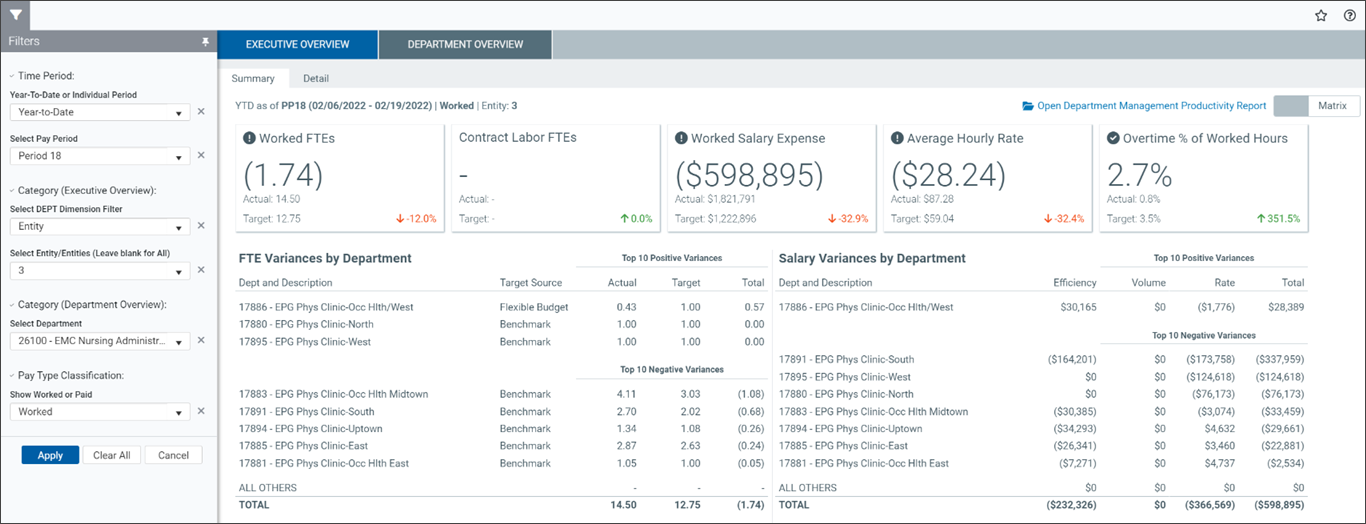
The Productivity Dashboard provides a visual representation of information from the Department Management Productivity report. Use the refresh variables in the Filter panel to update information displayed on the dashboard.
Dashboard tabs
The following tabs are available on the dashboard:
-
Executive Overview, which displays high-level, summarized productivity data intended for upper management.
-
Department Overview, which displays summarized productivity data for an individual department.
Security permissions
To access the dashboard, you must be assigned the following security permissions:
- Productivity Admin
- Productivity User
- Report Subsystem Permissions
Open the dashboard
Depending on your user privileges, you can open the dashboard in one of the following ways:
Non-administrative users
-
Open the Productivity Management pane in Axiom Assistant:
Main > Open App Menus > Productivity Management
-
Navigate to the Productivity Dashboard:
Bi-Weekly Productivity Reports > Department Management Productivity Dashboard
-
Apply the refresh variables.
-
Click Apply.
Administrative users
-
Open the Productivity Admin pane in Axiom Assistant:
Admin > Admin Task Panes > Productivity Admin
-
Navigate to the Productivity Dashboard:
Bi-Weekly Productivity Reports > Department Management Productivity Dashboard
-
Apply the refresh variables.
-
Click Apply.
Change the dashboard magnification
To zoom in or zoom out the dashboard view, press the CTRL key and scroll your mouse button:
-
Scroll forward — Increases the magnification (zoom in)
-
Scroll backward — Decreases the magnification (zoom out)
Refresh variables
After you open the dashboard, use the refresh variables on the Filter panel to dynamically update information that is displayed.
NOTE: Apply all possible refresh variables to reduce the total amount of data returned and improve processing efficiency.
| Refresh variable | Description | Required? |
|---|---|---|
| Year-To-Date or Individual Period |
Select Individual Period to review specific pay period data. Year-To-Date is the default selection. |
Yes |
| Select Pay Period |
Select a pay period to review that period's individual or year-to-date data. Current Pay Period is the default selection. |
Yes |
| Select DEPT Dimension Filter |
From the Executive Overview tab, select one of the following department dimensions:
|
Yes |
| Select Corresponding Selection |
Select the check box next to each corresponding classification from the DEPT grouping selection. For example, if Entity is selected as the DEPT grouping selection, select the Entity/Entities you want to review. To select all entities, leave all check boxes blank. |
No |
| Select Department | From the Department Overview tab, select the specific department you want to review. | Yes |
| Show Worked or Paid |
If you select Paid, the report displays Non-Productive and Total Paid columns. Worked is the default selection. |
Yes |